A Simon Fraser University research team has developed interactive post-pandemic recovery maps to highlight some of the long-term effects of COVID-19.
The project, which is led by Dr. Valorie Crooks, a professor in the department of geography and Canada Research Chair in Health Services Geographies, said for the past year, the research team she’s been working with has been “working on actually finding ways to develop map tools to be useful for helping us to understand what’s happening in relation to the pandemic.”
READ ALSO: B.C. COVID restart plan: Here’s who you can see, and where, as province reopens, May 25, 2021
And as the province moves into the first step of its restart plan, Crooks said the team “wanted to try and take a little bit of a pause from that dialogue and just point out the fact that there are going to be long-term health impacts, not simply related to those people who actually contracted COVID-19, but actually related to the pandemic measures that have been put in place to manage the spread of COVID-19 throughout the province.”
Crooks said the map looks at five factors: housing insecurity, job security, occupational burnout, loneliness/isolation and educational disrupt, adding they “set out to find factors that we know actually are contributing to these changes in health impacts based on evidence that is coming out of research that is starting to emerge.
She said while “we’ve now shifted” discussions to slowly going back to normal, those restrictions could have had “an impact on mental health and wellbeing, they can lead to the onset of stress, anxiety, depression, even post-traumatic stress disorder.
“There’s also reports of exacerbation of symptoms for people who are managing ongoing chronic illnesses, and certainly there will be other kinds of health impacts.”
Crooks said the research team hasn’t overlaid their map with ones from the BC Centre for Disease Control on case, positivity and vaccination rates.
READ ALSO: B.C. to start releasing neighbourhood-specific COVID numbers after data leak, May 7, 2021
READ ALSO: Surrey communities recording more COVID-19 cases also seeing lower vaccination rates, May 8, 2021
“Absolutely, there will be connections between hotspots … because we know that there’s a connection and the connection is around social vulnerability. People who are experiencing various axis of marginalization and inequity, we know that there’s this kind of profile emerging around hotspot neighbourhoods and it would be the same places that we really expect to see these secondary health effects.”
Crooks said, though, that the SFU maps provide an even closer look at neighbourhoods, which allows people to “unpack that (data) even more.”
“This is the smallest unit, geographically, that you can actually get census data in. It’s a much smaller unit. This is actually more reflective of neighbourhoods.”
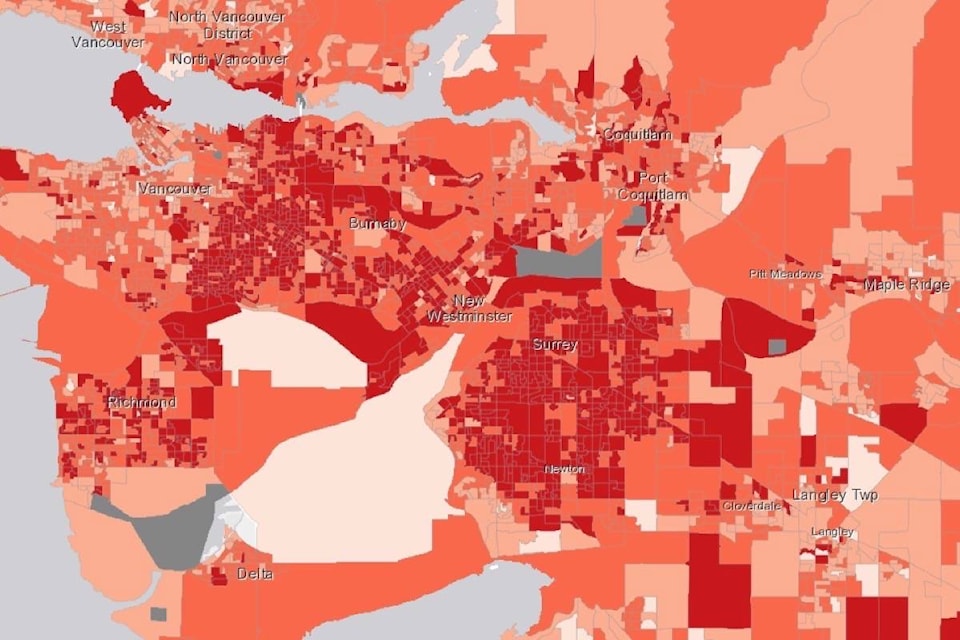
The maps are broken into “Personal Risks,” “Place-Based Risks” and “Overall Vulnerability to Risks.”
Looking at the “Personal Risks” map, the majority of north Surrey is shaded in the darkest red to imply that the relative personal risk is high. But that same colour is seen throughout most of the Lower Mainland, followed by an orange colour representing a medium-high relative personal risk.
In the “Place-Based Risks” map, north Surrey is a mix of high, medium-high and medium-low relative exposure risk.
Meantime, the “Overall Vulnerability to Risks” map shows all of Surrey to be a mix of high, medium-high and medium-low risk class.
Crooks said these disparities are spread out all throughout the province.
“You can see that communities in the north are vulnerable, communities in the Interior (too). This really tells us that need to actually start now thinking really carefully about things that we can do to assist with trying to support people who are going to be managing these secondary health impacts.”
But, she said, these secondary health risks can potentially be avoided.
“I could walk out on my deck and there could be a risk of a tripping hazard, but I wouldn’t trip and fall because I would step over it. The same is true with these factors, so actually, there could be things that we can actually do now to help intervene that would offset the development.”
COLUMN: Localized COVID-19 data could have helped Surrey communities hit hardest, May 22, 2021
lauren.collins@surreynowleader.com
Like us on Facebook Follow us on Instagram and follow Lauren on Twitter